An Overview of Geodesy and Geographic Referencing Systems
The magic of geographic information systems is that they bring together and associate representations from diverse sources and infer relationships based on spatial references. This ability depends on our data sources using well defined coordinate referencing systems. This is not to say that the coordinate systems need to be the same for each data source, only that the relationship between the coordinate references with some shared conception of the surface of the earth needs to be well described. Indeed, there are thousands of perfectly legitimate coordinate systems in active use. The notion of spatial referenicing systems is one of the most fundamental and interesting ideas that all users of GIS should understand. This document provides an overview of the basic ideas.
A Brief History and Theory of Latitude and Longitude
Latitude and Longitude provide a framework for referencing places on the earth. It is interesting that an understanding that is thousands of years old continues to be near the cutting edge of our cybernetic culture.
To tie this lecture together with the previous lecture on the context of geographic information systems, we will return to our framework for Geographic Models for Decision Support.
Big Ideas Covered in this Lecture
- geospatial Datasets employ Coordinate Referencing Systems (CRS) to characterize the locations and shapes of things at or near the surfcae of the earth.
- Topographic maps are assumed to provide a scale that can be measured in the same units no matter the direction.
- Latitude and Longitude are a way to distinctly reference any location on the planet. But Latitude and longitude are angular measures. They may be portrayed as if they were cartesian, but in most cases, this will distort sshape and distance such that using a scale to infer distance wil have very substantial errors. (see semonstration, below.)
- Creating reasonable portrayals of places requires us to understand how latitude and longitude reference a places on the planet, AND how latitude and longitude are transformed into cartesian coordinate systems that uphold the assumption that a map reflects consistent scale, direction, and shape proportion corresponding with the things and relationships being represented.
References
- A Tutorial Dataset for Projections
- Choosing a Map Projection
- A handy map of Universal Transverse Mercator System Zones by Alan Morton.
- The Online Help for ArcMap topic: About Coordinate Systems Is a good reference.
- Identifying an Unknown Coordinate System
- Updating the Coordinate System Properties of a Dataset
Earth Models
Latitude and Longitude are angles, not, in themselves measures of distance. In order to use these angular displacements to understand distance relationships on the surface of the earth, you need to know the radius of the earth at the points being referenced. This would be simple if the earth was spherical; but it turns out that if you use this assumption, the distances that you calculate will have substantial errors. Since about 1700 it was postulated by Isaac Newton that the earth is not spherical and a few years layer this was confirmed by actual measurements of a degree of latitude in different parts of the world. (see This great essay by Isaac Asimov or this Article from Scientific American. Therefore observations of latitude and longitude made on the surface of the earth must be qualified with a radius which is derived from one of many possible models of the Size and shape of the earth (or Earth Model.)When you gather together data for north america, you will find data registerd to the North American Datum of 1983, The World Geodetic Spheroid of 1994, and occaisionally the North American Datum of 1927. Data collected in other parts of the world likely use other local datums. Mis-specifying the earth model for a dataset can lead to displacements in your ground measurements of as much as 20 meters! See the ESRI manual on Spheroids. and Datumsfor a deeper discussion of these topics.
The Graphical Problem of Latitude and Longitude
One fundamental assumptions about topographic maps of places include the followiong:
- the map has a scale that can be used to measure distances all over the map,
- that the shapes that are represented on the map are a reasonable approximation of the shapes
- the cardinal directions are at right angles to one-another.
These assumptions are generally termed the assumption of Planimetric Scale. They are also the same assumptions of Cartesian coordinate systems that allow us to use plane geometry to infer distances. Furthermore, they seem to be rather instinctive in human beings, in as much as if you show a person a map that violates these assumptions, you are in effect tricking that person into faulty conclusions about your subject.
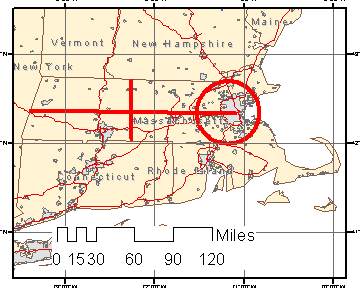
A very common instance of this sort of trap arises from the fact that datasets we are given often reference locations of points and vertices with decimal degrees of latitude and longitude. And mapping software will graphically portray the geometry so described as if latitude and longitude were coordinates in a cartesian sense. Yet, latitude and longitude are polar coordinates. A degree of Longitude does not have a constant scale in terms of distances on the earth. At the equator, this distance is approximately 100 km. Near the poles, an entire degree could be spanned by your little toe!
|
The map of Massachusetts in unprojected Decimal Degrees of Longitude and Latitude Note the proportion of the lines and the circle. The circle gives the impression that Worcester is approximately the same distance from Boston as New Hampshire, and that the state is nearly five times longer, east to west, as it is north-to-south. This misrepresentation of proportion has the same effect no matter how close you are zoomed in. Compare with the same data layers transformed according to the Massachusetts State Plane coordinate system system This shows an image that is much truer relative to distances you would actually experience on the ground. Worcester is actually much closer than it appeards before. And the state is only 3 times longer than it is tall. The grid on each map is one degree on a side. Using degrees of longitude and latitude as a cartesian coordinate system makes the grids appear square. But ion at the latitude of Massachusetts, the race of one degrees of longitude is much shorter than a degree of latitude. |
Transformation of Geographical Coordinates to Cartesian Coordinate Systems
While the system of latitude and longitude provides a consistent referencing system for anywhere on the earth, and it is therefore used in geographic databases that are not specific to a particular place. However, in order to portray our information on maps or for making calculations, we need to transform these angular measures to cartesian coordinates. These transformations amount to a mapping of geometric relationships expessed on the shell of a globe to a flattenable surface -- a mathematical problem that is figurastively refered to as Projection.
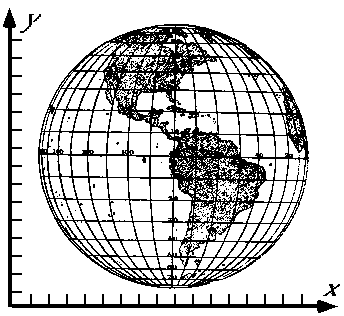
It turns out that any way you try to do this, you must unavoidably incorporate some distortion into the picture. Any projection has its area of least distortion. Projections can be shifted around in order to put this area of least distortion over the topographer's area of interest. Thus any projection can have an unlimited number of variations or cases that determined by standard paralells or meridians that adjust the location of the high-accuracy part of the projection.
Projection Cases
In the case of the orthographic projection above, the area of least distortion is occurs where the figurative projection plane touches the model of the earth. To create a projection that works well for a particular area, we can create a case of the orthographic projection that has its point of tangency wherever we want: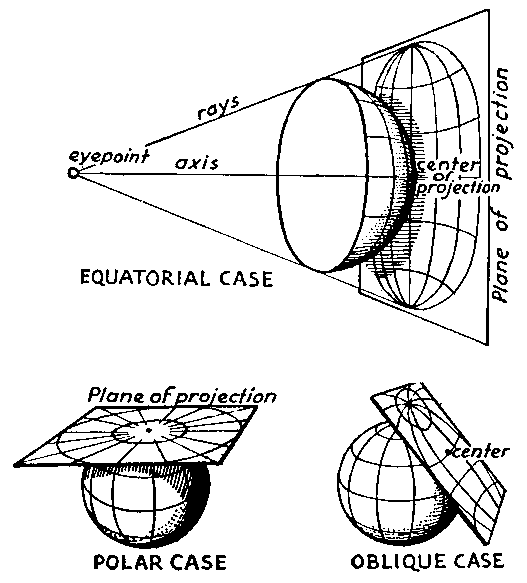
Other projection methods are based on more complicated flattenable projection surfaces, and instead of points of tangency, spacial cases of these projections can be made by adjusting their Standard Parallels or Central Meridians
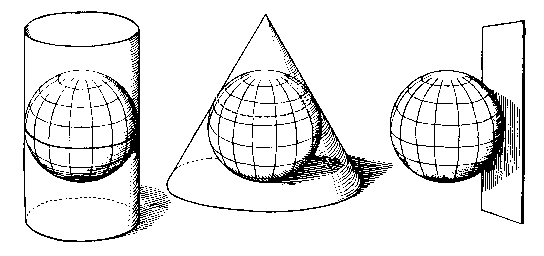
These images are by Erwin Raisz, who worked at the Harvard Institute for Geographical Exploration between 1931 and 1951 and wrote many fine books on cartography and topography.
The Mercator Projection
Presentation of uniform scale is not always the goal when using maps as graphical calculators. A case in point is the Mercator's Cylyndrical Projection, which is unique among projections in terms of portraying lines of constant compass direction (rhumb lines) as straight lines on the map, as shown on this site by Carlos A Furuti. In a zone along its standard paralell, the Mercator projection has good scale and shape and direction presentation along with its property that makes a a terriffic tool for aiming missles and artillery! This is why the Transverse Case of the Mercator projection was invented and is in such common use in broad-scale series of national mapping projects.
On-the-Fly Projection
Creating map projections used to be a VERY HARD THING TO DO! even just 30 years ago. And now we can project and unproject massive quantities of coordinates, transforming them backward and forward from Latitude and Longitude (assuming this or that earth model) to overlay precisely with data that are stored in some other coordinate space. It is truly amazing that humans have perfected a rich library of open-source software that can Forward Project geographic coordinates (latitude and longitude, + earth model) to any projected system; and also backward project) from any well described projected coordinates back to geographic coordinates -- all in the wink of an eye. We can be thankful for that. But there are still some details that we have to understand.
Automatic transformation of coordinate systems requires that datasets include machine-readable metadata. In about 2002, the makers of ArcMap added one more file to the schema of a shape file. The .prj file is the machine-readable metadata that allows ArcMap to know how the coordinates in the file relate to the surface of the earth. And this information wil lallow arcmap to do whatever transformation is necessary to get t6hat data to overlay corectly with other data regardless of the projection. There are plenty of datasets that do not include such machine readable metadata. This includes CAD data and data and shape files created with ArcMap before 2002. So we should get used to understanding map projections and their properties.
Metadata Issues with Map Coordinate Systems
Given that geographic datasets are primarly concerned with spatial references, we really must have metadata (data about the data) describing the coordinate system that is embedded in the files. Here is an example of the FGDC Content Standards for Geospatial Metadata regarding Coordinate Systems But in actuality, because most datasets make use of special cases of projections, much of this metadata can be generated automatically if we know the following facts about the coordinate system of a dataset:
- The Earth Model -- a key parameter for projecting and unprojecting the coordinates.
- If the coordinates are unprojected latitude and longitude, the coordinate system is known as Geographic Coordinates (GCS).
- If the geometry in the datsaset is expressed in Projected Coordinates then the metadata should specify the following:
- Projection Method
- Projection Case
- Coordinate Units (usually either Feet, or Meters)
Standard Projection Systems
Even though the projection method is almost always some sort of very long system of equations, for which the cases plug in several parameters, there are conventions for projections and cases that have handy names, like the State Plane Coordinate System used by most state and local government agencies in the U.S. Other countries have their National Grid projections. And almost always, systems of quadrangle maps use some variation of the Universal Transverse Mercator system of projectons and cases that divides the world into 60 longitudinal zones. see this handy map of UTM zones by Alan Morton.
Declaring Coordinate Systems used in Maps and Data Sets
There are two situations in which a person may need to declare a geographic coordinate system and/or a projection. Situation 1 is when presenting data on a map. The other is when data are encoded for the purposes of spatial analysis or overlaying with other data.
For a map with a scale finer than, say 1:1,000,000: the choice of projection establishes whether or not North and East stretch out at right angles and whether the a units of X and Y are nearly equal regardless of what direction of your measurement. The choice of projection establishes whether people can assume that shapes you draw on the map have any actual geometric correspondence with the actual geometry of the place on the ground. For a person who must judge whether your map is actually useful will get confirmwation of you declare what projection has been applied.
A projection declaration should state what projection method and case has been employed to transform the geometry of the earth to a flat screen or sheet of paper. An example of a projection method, would be "Lamberts Conformal Conic." Most if not all projection methods require a couple of parameters that state how the flattenable surface (a cone for example) is draped on the earth. IN the case of the Mainland Zone of the State Plane Projection of Massachusetts this case is defined as follows: per MassGIS:
The datum for the MassGIS database is North American Datum 1983 (NAD83).
The data are registered to the Massachusetts State Plane Coordinate System,
Mainland Zone (Fipszone 2001). Units are meters. (Some imagery for Martha's
Vineyard and Nantucket are also available in the Mass. Stateplane
Island Zone).

The EPSG (European Petroleum Survey Group) code for this coordinate system
is 26986.

The Massachusetts State Plane Coordinate System, Mainland Zone meters is
defined as follows:

Projection:  Lambert Conformal Conic
     Spheroid:  GRS 80
     Central Meridian:  -71.5
     Reference Latitude:  41
     Standard Parallel 1:  41.71666666667
     Standard Parallel 2:  42.68333333333
     False Easting:  200000
     False Northing:  750000
Rather than saying all of that, you can simply declare it like this
- Projection: Massachusetts State Plane Mainland Zone.
-
Projection: Universal Transverse Mercator Zone 19
When encoding and exchanging data. Geographic data identify the relative location of vertices or pixels -- relative to eachother -- using coordinates. In order for a computer application to overlay data sets having different coordinate systems, each data set must have a very specific declaration that explains how the coordinates used in the data relate to the surface of the planet. For the purposes of overlaying data in computers much more specific information is required about specific parameters assumed for the shape of the planet (Earth Model) Examples of Earth Models include: North American Datum of 1983, or World Geodetic Spheroid of 1984. Misidentifying the earth model for a dataset can result in apparent shifts in terms of the overlay of one data set on another of up to a couple of meters (see the maps on page 17 of NOAA Technical Memorandum NOS NGS 50).
Assuming that each data set has its projection identified correctly, then the GIS program can be assumed to be doing an adequate job of overlaying the individual data layers adequately. In this situation, the cartographer can ask the GIS to reproject all of the data to suit the geometric properties that are desired for the map at hand. The choice of an earth model does not affect the gross geometry of the map in any sense that a person would be able to see.
As with the projection cases that have short-hand abbreviations that make it easier for coders to be specific about a projection case withoug always listing al lof the individual parameters. This is the function of terms like The Federal INformation Processing Standard Projection Zone 2001 (FIPS 2001), or The European Petroleum Survey Group Projection Zone 26986. (EPSG 26986).Credibility is a make-or-break issue for cartographers. Educated map users will attempt to assess the credibility of an analyst by looking for careful choice of words when speaking about data, attribution of source material and declaring the critical transformations that that have been applied. You will gain credibility points by declaring what is necessary to declare and not asking people to dwell on details that are irrelevant, redundant or unfounded. You should definitely avoid using abbreviations that you have not expanded. The habit of tracking down and expanding abbreviations before you use them will save you from the oblivious embarrassment of using terms that you don't understand.
Parting Thoughts
Aside from being a very important and interesting and continuing thread in the history of humanity's struggle to understand their surroundings, the evolving understanding and application of Geodesy and Topography offer a very important lesson for anyone who would attempt to understand the world through representations or models. Understading the logic of one's referencing systems is crucial to understanding the utility of your conclusions. Choosing a projection means choosing one sort of error over another. This sort of choice comes into play with almost every decision that an educated person makes when creating and evaluating maps and GIS.
Additional References
- The projection Pages of Carlos A Furuti Especially, his pages about the graphical properties of the Mercator projection
- John Snyder An obituary of the man who achieved immortality by computerizing the mathematical algorithms for transforming map projections.
- Spatial Effects The web Site of former GSD Student Geoffrey Dutton, who sees the future when we can store and work with coordinates that are regular but not orthogonal.
- Claudius Ptolemey More
- The National Atlas Article on Map Projections
Part 2: A Projection Demo:
Will prove that all GIS Users Must Understand how to Choose a Suitible Local Projection!
Understand Map Projections
Our assignment is to make maps of regional and local context. On maps of this scale, we should assume that the assumptions of topographic interpretation will apply, namely:
- Distances measured on the map will have a consistent scale no matter what part of the map they is measured.
- the cardinal directions, North, South East and West will meet at right angles. (typically North is at the top of the map, but not necessarily.
Our map-making task begins by understanding how ArcGIS transforms the geometry expressed in our data -- which may have their geometry encoded using any number of different coordinate systems that do not have the properties described above. Our GIS must transform these data into a map projection that does have these properties. This means we have to choose an appropriate projection method and case for our subject area. These concepts are discussed on the web page, Geographic Coordinate Systems and Map Projections.
Download the Demo Dataset
- Right-click this link and choose Save target as and save it into your C:\temp folder.
Start your Map by Opening a Layer
We will begin our map by going to our data collection and adding some a layer of World Countries from the World_Reference folder saved in our sources folder. Having added this Here we will observe that ArcMap sets the map projection of our Data Frame to adopt the native projection of the datasets that we open. To make this clear, we will begin by opening some world-wide reference layers that will help us choose an appropriate projection for our map.
- Start a new map document in ArcMap
- Inspect the Data Frame Properties (double click the thing called Layers at the top of the table of contents to check the geometric transformation being applied to the map.
- From the tutorial dataset, add the world_countries.shp shape file from the world_reference folder of our sample dataset.
- Check the coordinate system properties of the world_countries.shp layer -- listed among the Source Properties for the layer. See how the Data Frame adopts the coordinate system of the first dataset that you open.
- Check the projection properties of the data frame. See how the data frame has adopted the coordinate system of the first layer we have opened.
- Add the layers from the streetmap folder within our greenline_ext folder. You will find this in /sources/esri_streetmap/roads.lyr, and check the spatial reference property of these datasets.
- add the USGS_Hydro, MBTA, towns and openspace Layers from the greenline_ext/sources/massGIS folder.
- Take a look at the native coordinate system of the MassGIS layers. Note that the ArcMap project is transforming the geometry of the massGIS data to overlay with the other layers, even though the data have their coordintaes defined according to two different systems!
This sequence of steps illustrates a couple of important things. First, that the projection of our map is determined by the order in which we add datasets to the map. Second, that subsequent layers that have their coordinate systems defined can be transformed on-the-fly to overlay coherently with the other layers in the map, regardless coordinate systems inherent in the other layers.
Investigate the Geometric Properties of your Map
If you thought that our discussion of map projections in class was merely academic, the following series of steps should drive home the fact that a failure to understand the projection of a map can lead to a very major blunder. Understanding this, you will agree that a map intended to be used for interpreting shapes and directions should declare what projection has been used to transform the data.
References
Create and Measure a "Square"
- Look for the Draw Toolbar at the bottom of your Arcmap window. If you don't find it, right-click on an empty part of the toolbar ribbon at the top of the window, and check the box next to the word Draw
- On the draw toolbar there is a little pulldown that has a square in it. Pull this down to choose the Rectangle Tool
- Zoom in to a small neighborhood on your map.
- Hold the shift key and click-drag a graphical square that covers several blocks in your street map.
- Double-click this graphic and adjust the properties so that it has no fill and a thicker red outline.
- Now choose the Measure Tool from the standard ArcMap tool palette.
- The default units for the measure tool may be decimal degrees.
- Inspect the length of one edge of your square in decimal degrees. What does this mean? IN fact, measuring the length or an area of a shape in terms of degrees is meaningless. Degrees alone are not useful measures of length or area.
- Click the Sigma button on the Measure tool palette to change the length and are units to units that are comfortable for you. Now measure the edges of the square, first in the East-West direction, then in the North-South direction.
- Hmmm. Question: When is a square not a square? Answer: when it appears on a large-scale map that is using an inappropriate projection!
Choose an Appropriate Transformation for your Map
From our Map Projections you are aware that you must always be aware of how ArcMap is transforming the geometry of your data to display on your map. If you let ArcMap choose the method for transforming the geometry in your data, you will very likely be portraying the directions sizes, shapes, and relationships of the entities in your map in a substantially distorted way. This will make your north arrow and your scale bar more or less useless. Therefore, you should understand how to choose an appropriate projection for your map. And if you want to bolster your credibility, put a note under your scale bar to reflect the projection case that you have chosen.
References
- Inspect the Data Frame Properties (double click the thing called Layers at the top of the table of contents) to check the geometric transformation being applied to the map.
- Use the Drawing Tools to draw a circle on the map centered on some detail that you can find again.
- Open the shape files for the US State Plane Zones and the Universal Transverse Mercator zones in your map. These are in the gis_tutorial/world/ folder. Normally you can find these in Program Files(x86)/ArcMap/Referencing_systems folder.
- Use the Information Tool to find the appropriate State Plane Zone for your area of interest. For the Boston area, the most common projection would be Massachusetts State Plane, Mainland Zone, projected on the North American Datum of 1983.
- Set the transformation for your data frame appropriately. Note that the Compilation.mxd that for this exercise is set up with the correct projection already.
